Climate - Past, Present, and Future
Climate and Greenhouse Gases
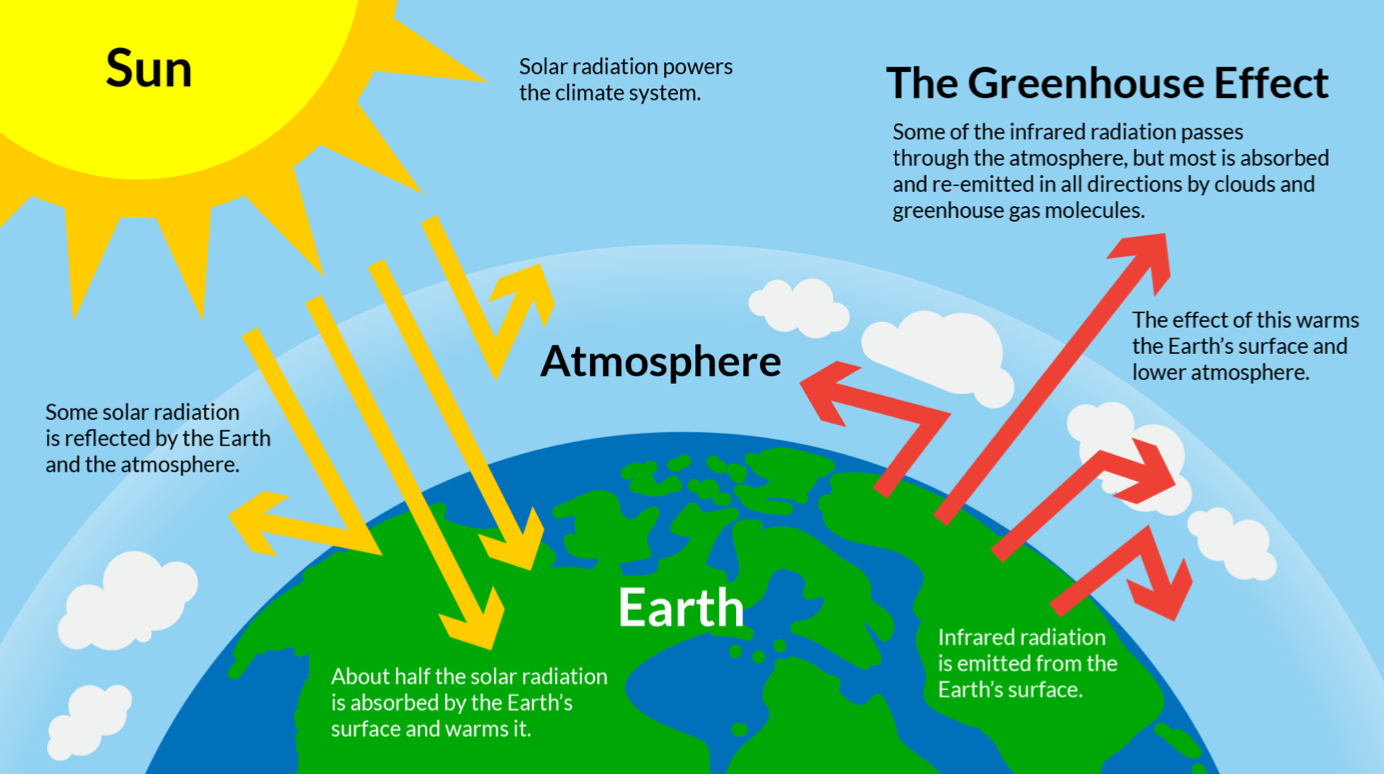
- Similar to how a greenhouse works:
- Instead of glass trapping the solar energy that is radiated back as infrared radiation, greenhouse gases (GHG) trap it in the atmosphere
- GDGs include water vapor (most abundant), and
Earth is ~ on average and without the natural GHG effect it would be .
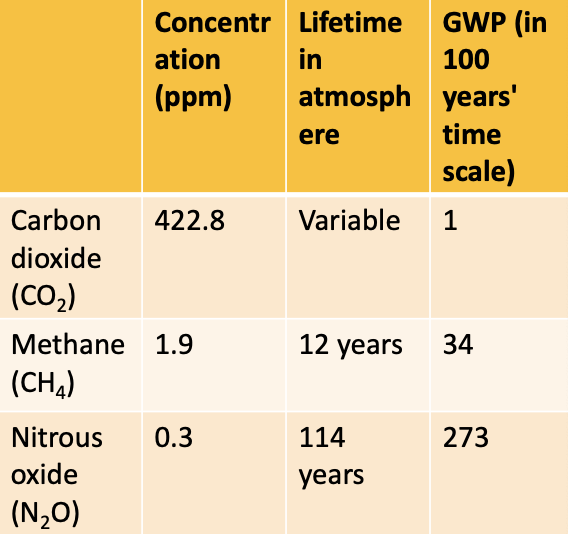
Each GHG’s effect on climate depends on three main aspects:
- Gas concentration (usually measured in parts per million or per billion)
- ppm
- Gas lifetime in the atmosphere (how long a gas stays in the atmosphere until it is ‘sequestered’ by biological or chemical processes)
- Global Warming Potential (GWP) of the gas (a gas’s ability to trap heat in the atmosphere relative to )
True or false?
- The most abundant GHG in the atmosphere is water vapor
- ’s ability to trap heat is more than 30x greater than that of in a 100 years perspective
- is a dominant GHG in our atmosphere
- Steadily risen the last 80 years
Global Fossil Emissions
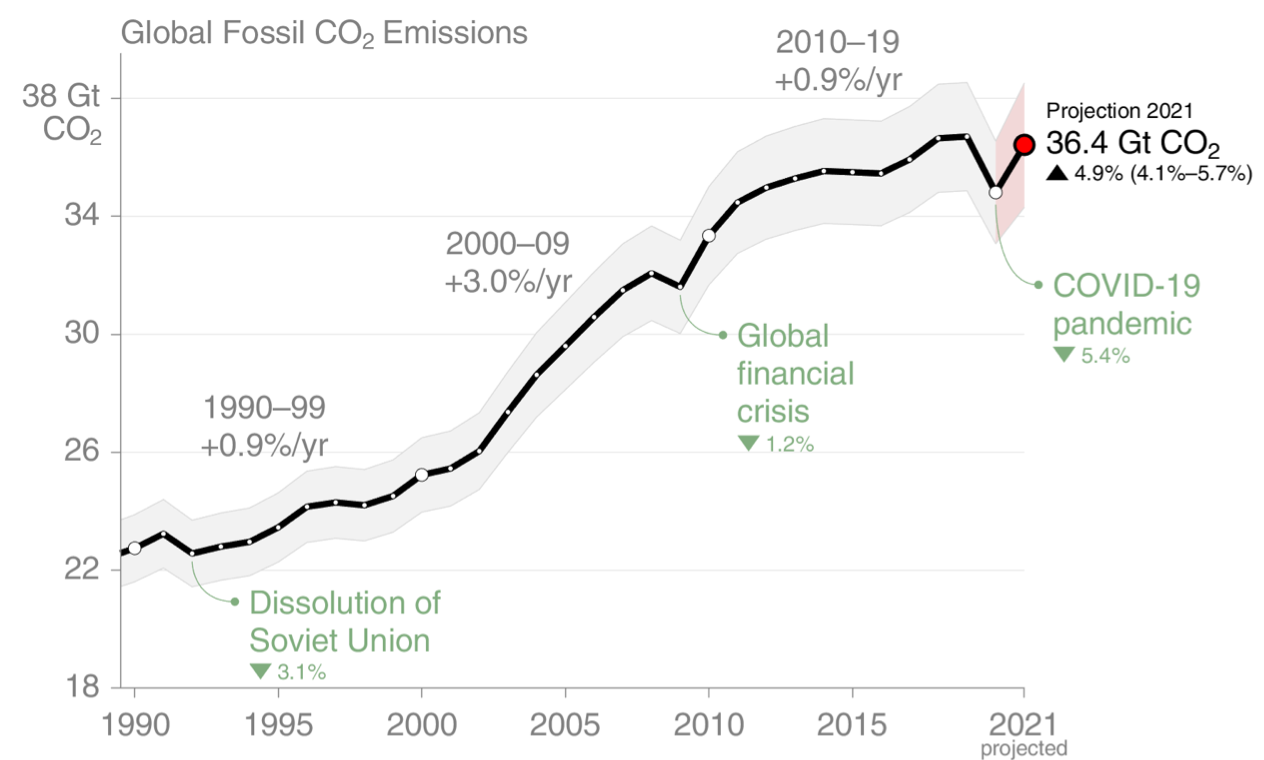
Global fossil CO2 emissions: 37.1 ± 2 GtCO2 in 2021, 63% over 1990 Projection for 2022: 37.5 ± 2 GtCO2, 1.0% [0.1% to +1.9%] higher than 2021
is not the only GHG
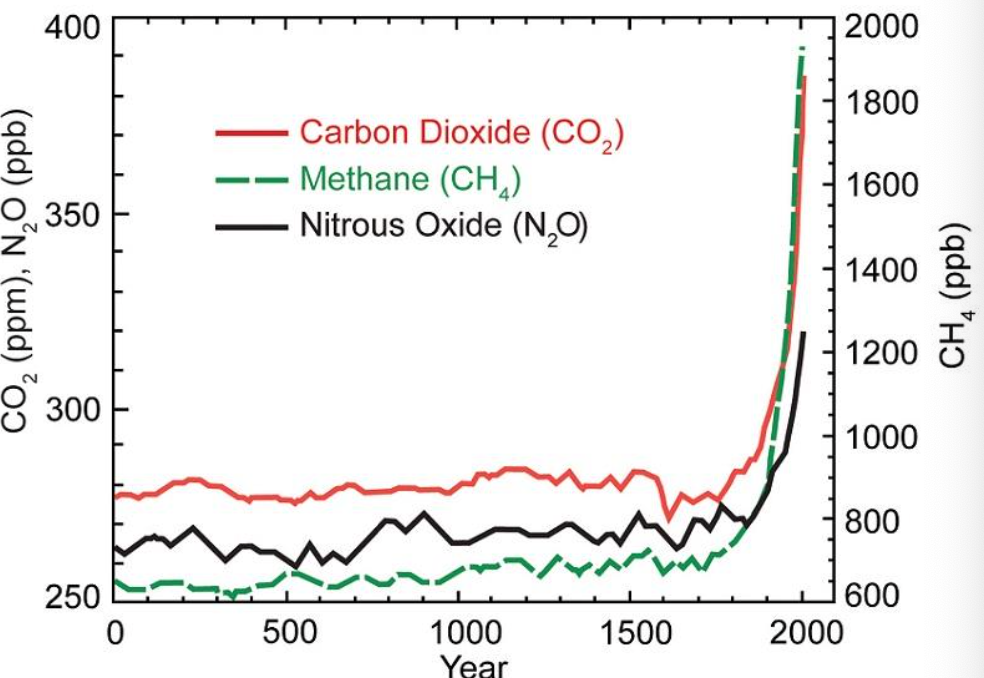
Since 1750, three GHG concentrations in our atmosphere have risen dramatically
- by ~20% (Nitrous Oxide)
- by ~50% (Carbon Dioxide)
- by ~270% (Methane)
Methane
- is more potent of a GHG than and is shorter lived
- Reduce now see rapid reductions in warning
Global methane Pledge COP26 in Glasgow, UK – Nov 2021
- Reduce CH4 emissions by 30% of 2020 levels by 2030 • Eliminate 0.2°C warming by 2050
- countries have signed on
- Must also report national CH4 inventories under their commitments to the UNFCCC
True or false?
- The main source of and to the atmosphere is the burning of fossil fuels
- is the GHG with the highest increase in concentration in the atmosphere since 1750
How much has the Earth warmed?
Since 1880, global average temperature has risen by ~. 10 warmest years on record occurred since 2005: 2005, 2013, 2010, 2014, 2018, 2017, 2015, 2019, 2016, 2020
Check out the ‘Time Series: 1884-2022’ visualization on this webpage: https://climate.nasa.gov/vital-signs/global-temperature/
Consequences of Rising Temperatures
Melting of ice sheets
- If all ice melted, sea level could rise by 75 m (thousand of years)
- If West Antartica ice sheet melted, 5-7 m rise occurs (hundreds of years)
Melting of Arctic sea ice - impact on ecosystems and local communities
Checkpoint 3
- Why is the Arctic sea ice more vulnerable to melting than the Antartica ice sheet?
- Temperature sensitivity
- Ocean circulation
- Albedo feedback
- Feedback loops
- The consequences of ice melting in the Arctic don’t include sea level rise, just as the melting ice in a glass doesn’t make it overflow. True or false?
- False
Melting and loss of permafrost
- Permafrost: permanently frozen ground
- Destabilizes roads and buildings in far north
Permafrost in Canada
- Massive amount of carbon stored in permafrost
- Degradation of that carbon when melted produces GDGs, which are emitted to the atmosphere
- Wildfires becoming more common with warming, burning the stored carbon and releasing
Checkpoint 4
- Thawing permafrost exposes old carbon to microbial degradation, leading to the production of the GHGs and . True or False?
- True, thawing permafrost exposes previously frozen organic matter to microbial degradation. As this organic matter decomposes, it releases greenhouse gases such as methane (CH4) and carbon dioxide (CO2) into the atmosphere. Methane, in particular, is a potent greenhouse gas, so the release of methane from thawing permafrost can further contribute to climate change. Therefore, the statement is true.
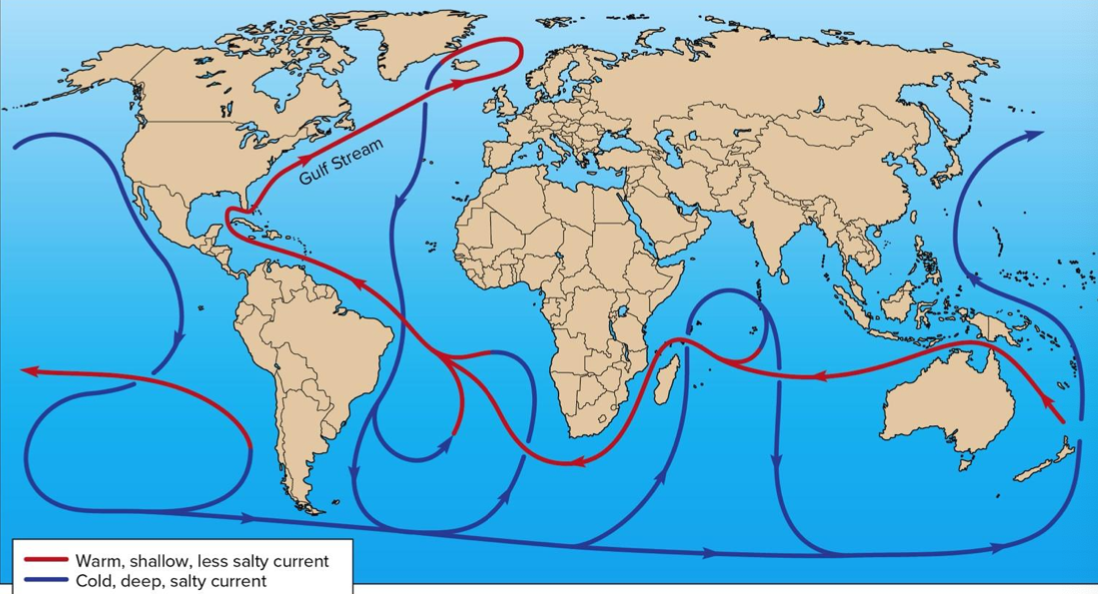
Oceans and Climate
- Oceans, which cover of the Earth, have huge impact on climate by absorbing heat.
- Increase in heat content of upper 70 m of ocean from 1993 to 2003
- Water vapor is a GHG, but the atmosphere is in equilibrium with the oceans with respect to it
- Oceans absorb, circulate, store, and release heat
- Temperature (and salinity) drive ocean circulation thermohaline circulation
- Ocean circulation dictates much of the climate and weather patterns
- Gulf Stream and North Atlantic are important drivers of overall thermohaline circulation
- Melting Greenland ice can slow circulation
Checkpoint 5
-
When ice forms in polar regions, the salty, dense water that forms sinks and less dense water is pulled up, stetting up the ocean circulation system. True or false?
-
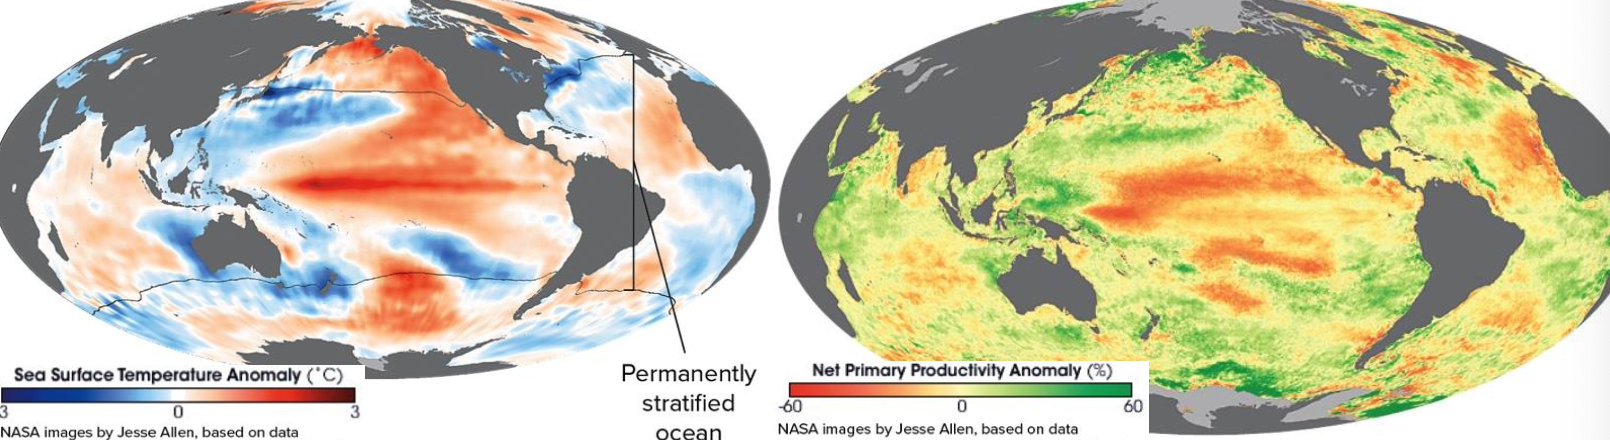
El Niño and La Niña: changes upwelling and near surface temperatures in the Pacific Ocean
- Warming during El Niño
- Cooling during La Niña
-
Cyclic: every 4 to 7 years
-
Associated with
- Changes in frequency and intensity of Pacific storms
- Droughts and floods
- Changes in monsoon season in India
-
Still learning about this cycle and others in the oceans
Chatgpt
It seems like you’re summarizing the key characteristics of the El Niño-Southern Oscillation (ENSO) phenomenon, which indeed has significant impacts on global weather patterns. El Niño events typically bring warmer-than-average sea surface temperatures in the central and eastern Pacific Ocean, while La Niña events bring cooler-than-average temperatures in the same region. These temperature anomalies can disrupt normal weather patterns, leading to various impacts such as changes in storm frequency and intensity, droughts, floods, and alterations in the monsoon season in regions like India.
Checkpoint 6
- El niño is a natural event caused by a reduction or interruption of offshore winds off the west coast of South America, which precludes ocean upwelling and leads to consequences to local and global weather.
- True. El Nino is indeed a natural phenomenon caused by a reduction or interruption of offshore winds off the west coast of South America. This interruption disrupts the normal upwelling of cold, nutrient-rich water in the eastern Pacific Ocean, leading to warmer-than-average sea surface temperatures and significant impacts on local and global weather patterns.
Global Change - a more appropriate term
- Earth is warming, but the consequences of the warming is expressed in changing ice trends, storm patterns, ocean circulation, etc. and varies locally
- Term ‘global change’ is more often used now
- Global change may not be felt or even be beneficial for some regions:
- Temperate regions may not be harmed by some warning and a bit more/less rain
- Dry regions might benefit from productivity (i.e. more biomass) because of more rain
- But in other regions, small changes can mean drastic changes:
- Hot and dry areas that can barely be cultivated may not survive less rain
- Small increase in temperature in a cold region may cause large increase in productivity
Extreme Events
-
Recent evidence suggest more extreme storms, droughts, and heat waves are occurring as a result of climate change
-
In the USA, extreme-weather events costing a billion USD or more occurred…
- 9 times in 2013
- 8 times in 2014
- 10 times in 2015
- 15 times in 2016
- 15 times in 2017
-
Cannot easily prove the connection between climate change and increase in frequency of extreme events, particularly because of local weather variability, but something is going on…
-
Environment and Climate Change Canada (ECCC) discusses the extreme weather events of 2021
-
More happened in 2021 compared to the other 25 years they have been compiling this list
- Record heat
- Record cold
- Heat waves
- Floods
- Droughts
- Wildfires
- Tornados
- Hurricanes
2021 was the most expensive and destructive. Until 2023…
- Declining phytoplankton biomass in the surface of the ocean, which can have repercussions up the food chain, linked to warming regions of the oceans
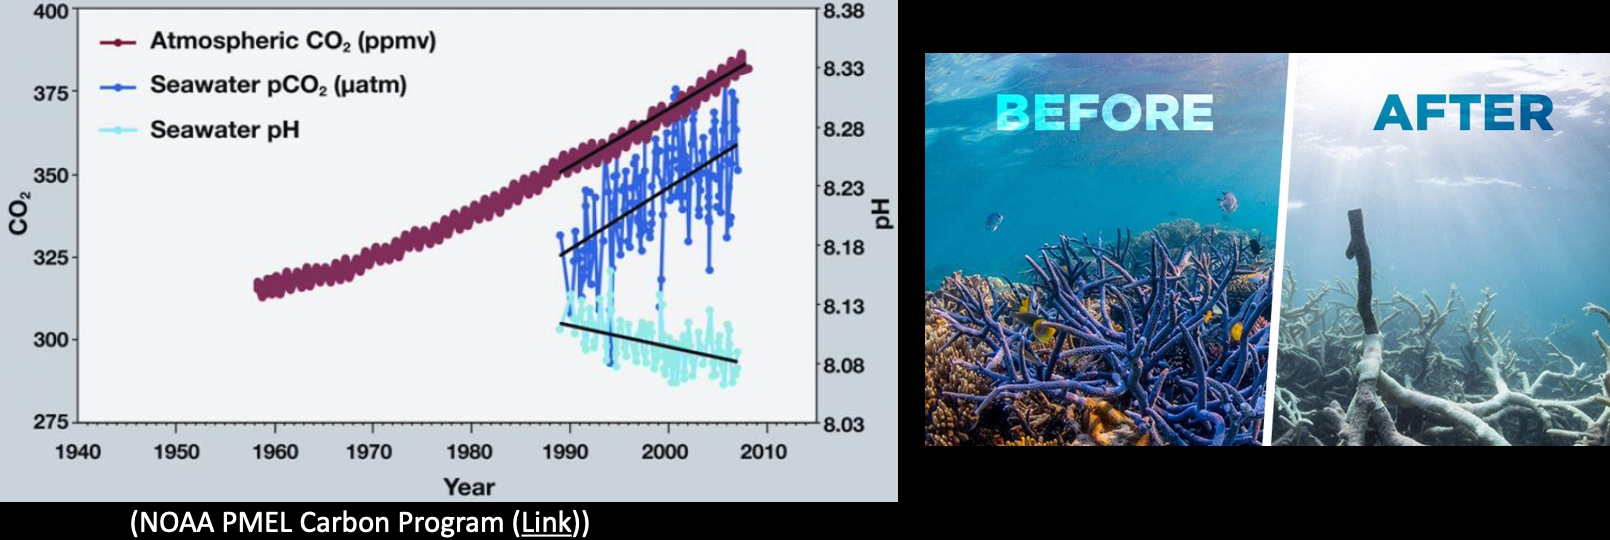
Coral bleaching
- Acidification: Ocean CO2 increasing with atmospheric CO2 ⇒ more carbonic acid ⇒ inhibits building of calcium carbonate (CaCO3) shells by marine organisms, like coral
- Warming temperatures causes corals to expel the algae that gives them their colour
- Occurrence and distribution of diseases linked with climate
- Diseases carried by mosquitoes reflect changes in mosquito dynamics due to a warming climate
- Waterborne parasites and bacteria may increase with increased rainfall
Checkpoint 7 - True or False?
- Reduced photosynthetic activity of phytoplankton in warmer seawater affects both the marine food web and atmospheric CO2.
- Warming may have positive consequences in some parts of the globe, such as reduction of certain diseases locally.
- Don’t think so
How do we know what climates past were like?
-
Clearly, we cannot measure past temperatures. Instead, we use proxies:
- Use the geologic record: look for features of past climate conditions in a region
- For example, glacial deposits in now temperate or tropical regions; coal deposits in drier, less productive regions; fossils of cold- or warm-climate animals in the opposite climate. Recall that we can date the age of rocks and identify a time period.
-
Use the chemistry of sediments, seawater, snow, ice
- For example, the presence and abundance of shells of organisms in marine sediments relates to temperature because the solubility of in seawater is dependent on temperature.
- For example, oxygen isotopes (/) in or skeletons of marine organisms found in sediments or in the ice of ice sheets relates to temperature.
-
is lighter than , so it is preferred in evaporation (i.e., creation of water vapor)
- is heavier than , so it is preferred in precipitation
- Fractionation between and is temperature-related
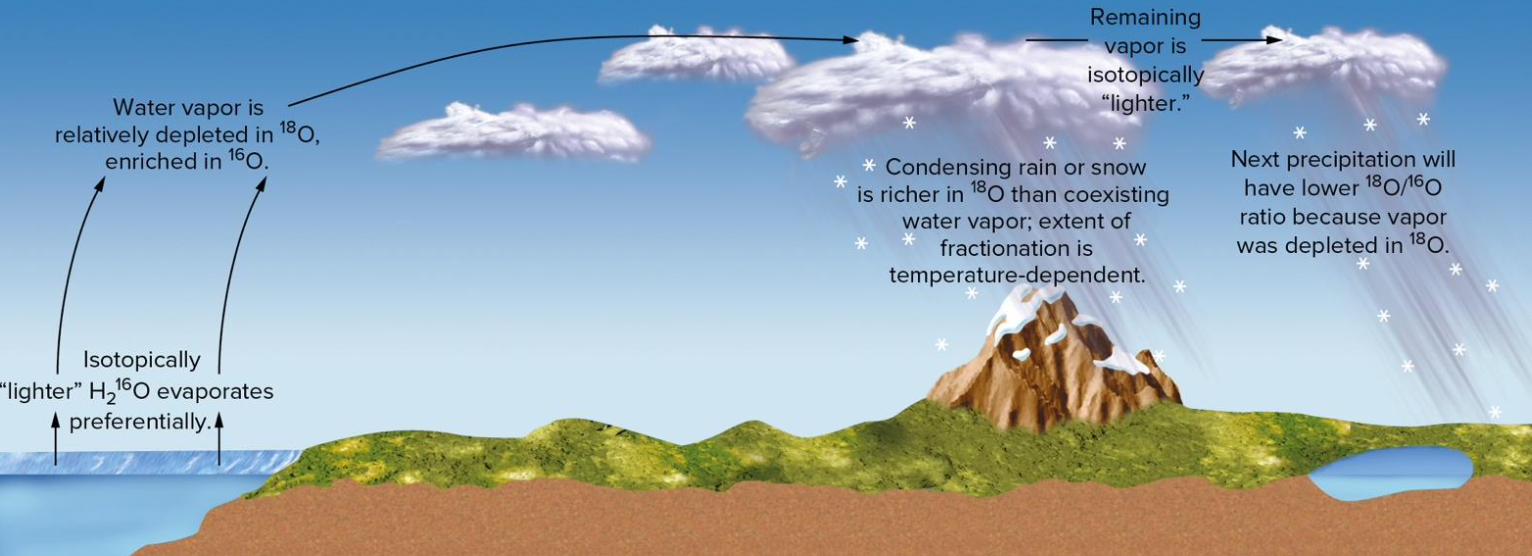
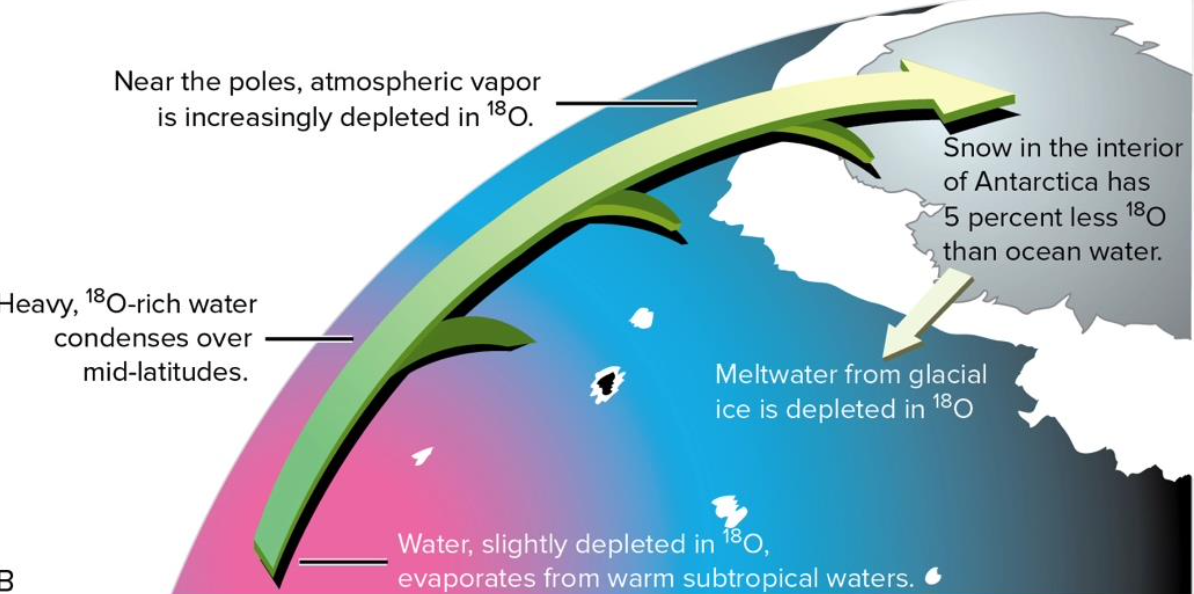
- 16O/18O from Antarctic and Greenland ice reflects the ocean / and temperature at the time
- Ice cores also contain air bubbles that provide concentrations at that time
- Ice cores can be dated by various methods, then very long climate records can be produced
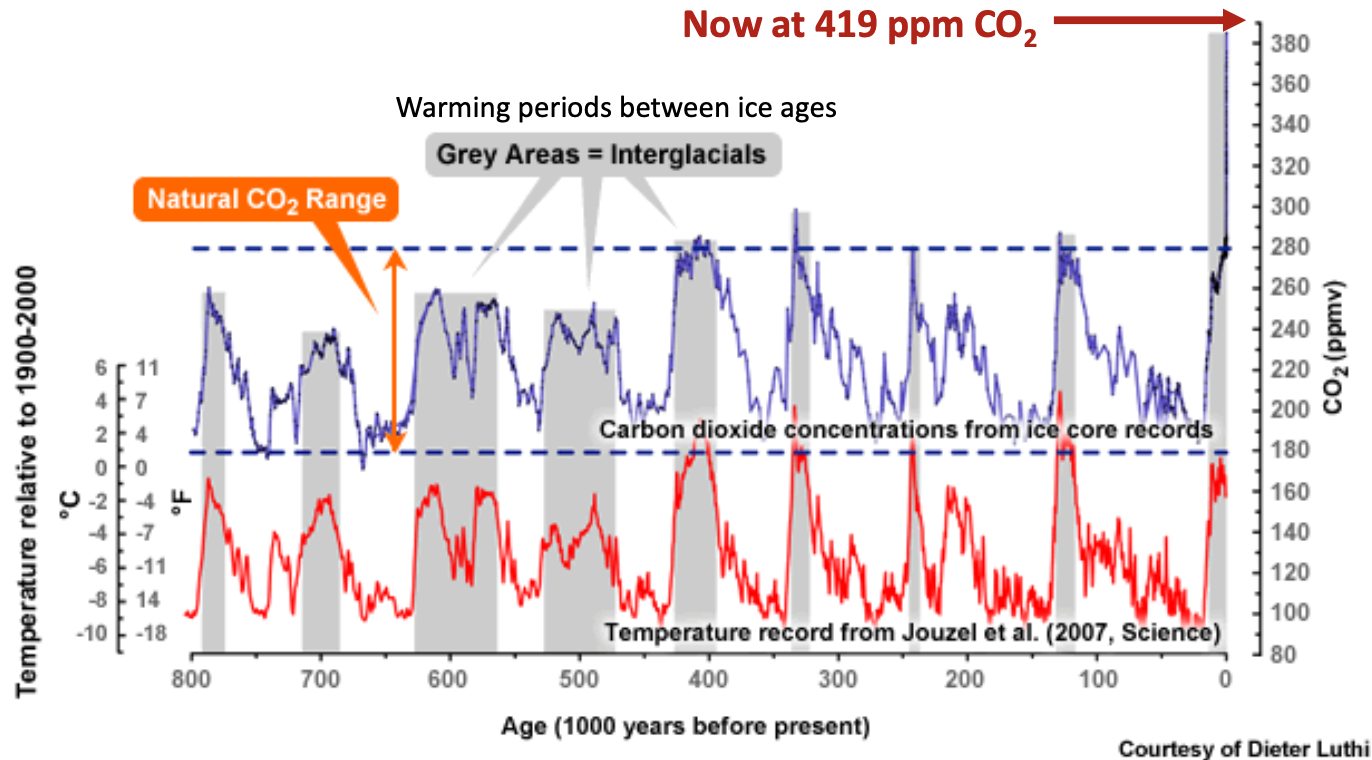
Past Climate Records
- Strong correlations between , , and temperature change revealed in ice core data
- Although correlations do not tell you which was the cause or which was the effect
We are now at unprecedented levels of
CO_2seen in the last 800,000 years of Earth's history.
Climate Feedbacks and Prediction
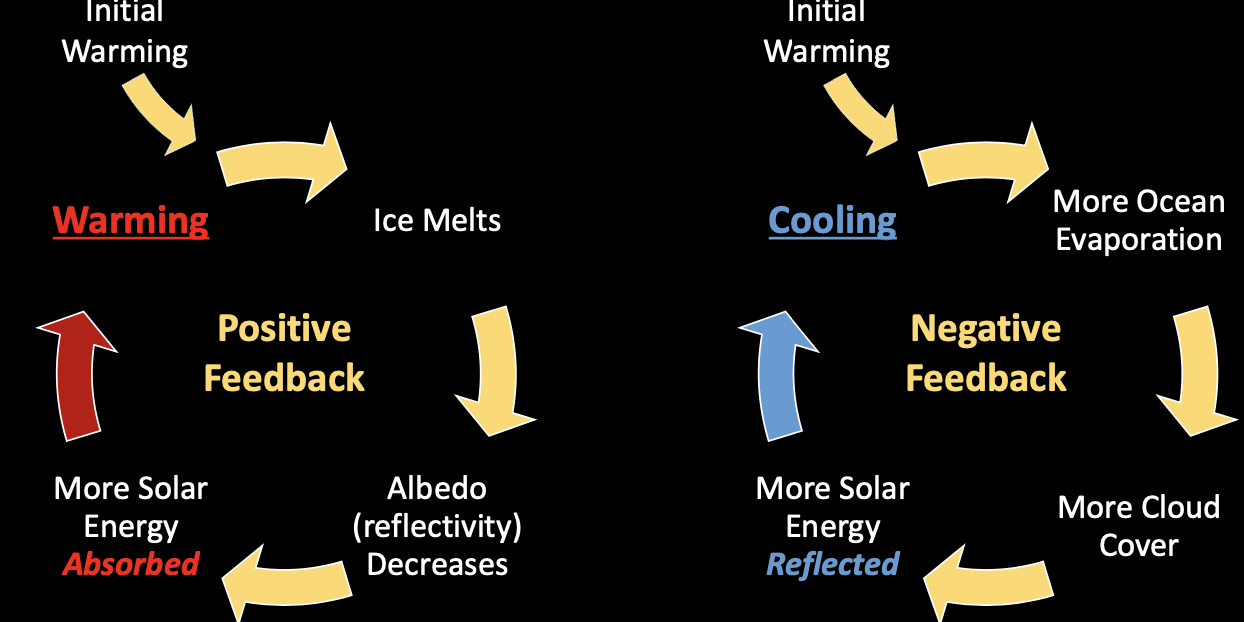
Climate Feedback
A consequence of climate change that either amplifies climate change (positive feedback) or counteract climate change (negative feedback)
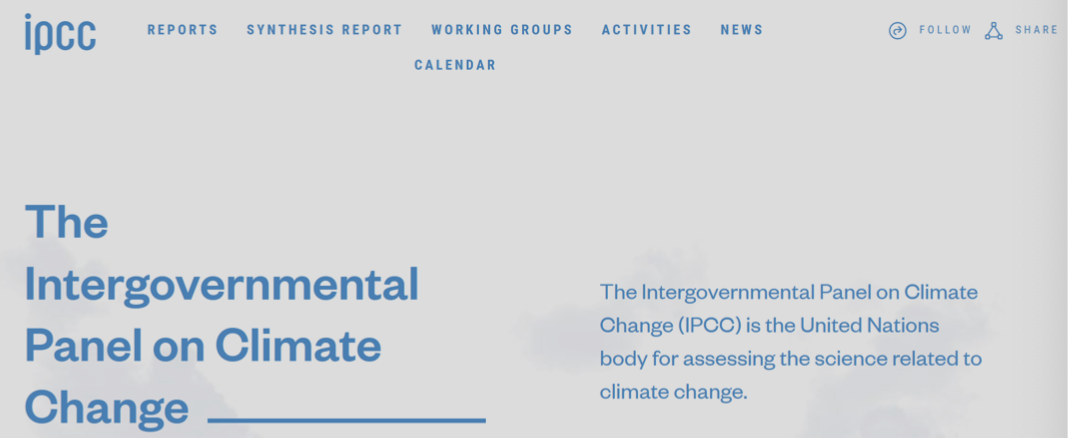
- Established 1988
- Assessment Reports in
- 1990 (AR1)
- 1995 (AR2)
- 2001 (AR3)
- 2007 (AR4)
- 2013/2014 (AR5)
- 2021/2022 (AR6)
Three Working Groups that produce reports:
- Comprehensive assessment of all the current science on climate change
- Evaluates how patterns of risks and potential benefits are shifting due to climate change
- Assesses literature on the scientific, technological, environmental, economic and social aspects of mitigation of climate change
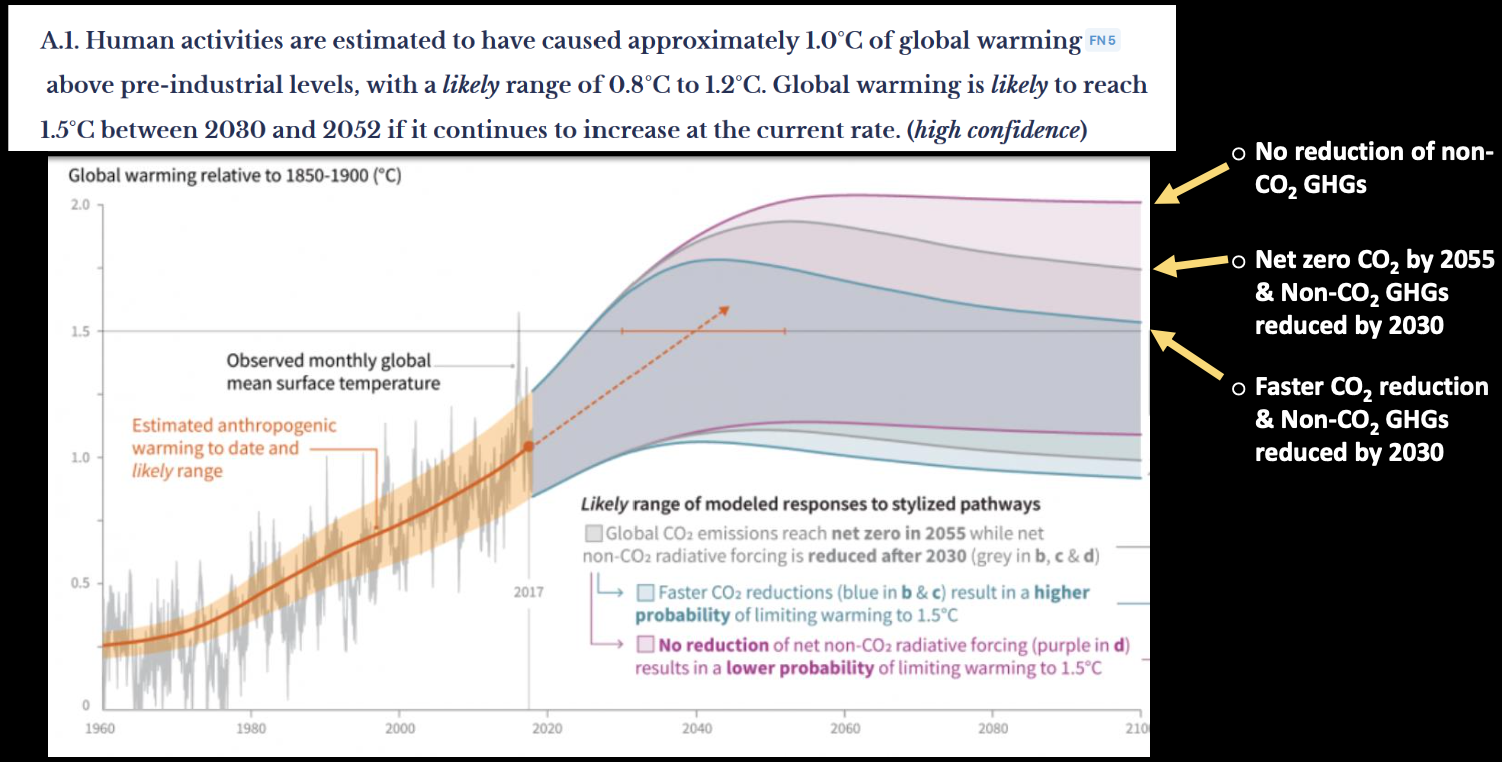
In 2018, the IPCC released a special report Global Warming of 1.5°C
Prevention
- Geoengineering techniques
- Giant reflectors in space
- Injecting clouds with aerosols to mimic cooling effects of volcanic ash
- Spray seawater to form more clouds
- Fertilize the oceans to promote more phytoplankton to take up more CO2
- But…
- What are the consequences locally?
- What are the feedbacks?
- Who will fund it?
- Who will do it?
- In the meantime, world leaders and scientists try to come to practical decisions that mostly involve reducing our direct GHG emissions and activities that indirectly promote GHG emissions